Speed measured on your visitors’ actual devices. LCP, CLS, INP, TTFB and FCP collected from real visits by the same sub-6 kB tracker, graded at the 75th percentile, broken down page by page, and never metered.
In short
What is Core Web Vitals monitoring?
Core Web Vitals monitoring measures how a page actually performed for the people who loaded it: how long the main content took to appear, how much the layout moved under them, and how quickly it responded to a tap. mrkr collects these from real visits and grades each page at the 75th percentile, which is where the published thresholds are set.
The distinction that matters is field against lab. A synthetic audit runs your page once, on a machine you chose, on a network you chose. Field data is what happened to real people on the devices and networks they have. Only the second one is what the thresholds are judged on.
For a one-off look at a single URL, the free Core Web Vitals checker runs in the browser with no account. Continuous field data across every page and every visitor is what the rest of this page describes.
Compared
The five metrics, and where the lines are. mrkr grades against the published thresholds at the 75th percentile. Three of these are the Core Web Vitals proper; the other two are diagnostics that usually explain them.
| Metric | What it measures | Good | Poor above |
|---|---|---|---|
| LCP | Time until the largest visible element finishes rendering | 2,500 ms or less | 4,000 ms |
| CLS | How much visible content shifts around during load | 0.1 or less | 0.25 |
| INP | Latency from a tap or click to the next paint | 200 ms or less | 500 ms |
| TTFB | How fast the server returns the first byte | 800 ms or less | 1,800 ms |
| FCP | When the first piece of content paints | 1,800 ms or less | 3,000 ms |
Thresholds are the published web.dev values. A metric between the good line and the poor line is graded as needs work rather than being rounded to a pass.
Compared
Field data against a lab run.
A synthetic audit
- One run, on one machine, on a network you picked.
- Reproducible, which makes it good for testing a fix.
- Tells you what to change, in specific terms.
- Does not tell you what any real visitor experienced.
mrkr, from real visits
- Every visit that reported a metric, on the devices your audience actually has.
- Graded at p75, with p95 alongside so the tail is visible.
- Broken down by page, so a slow template is identifiable.
- Filterable by device, country, source and campaign like everything else.
Performance sits next to the traffic.
The reason to have vitals in your analytics rather than in a separate performance tool is that the questions are joined. A page that is slow only for mobile visitors from one country is a CDN question. A page that is slow for everyone is a page question. You need the segment to tell them apart, and the segment lives in your analytics.
Every filter that works elsewhere works here, so a vitals number can be put behind one device class, one country, one campaign or one traffic source.
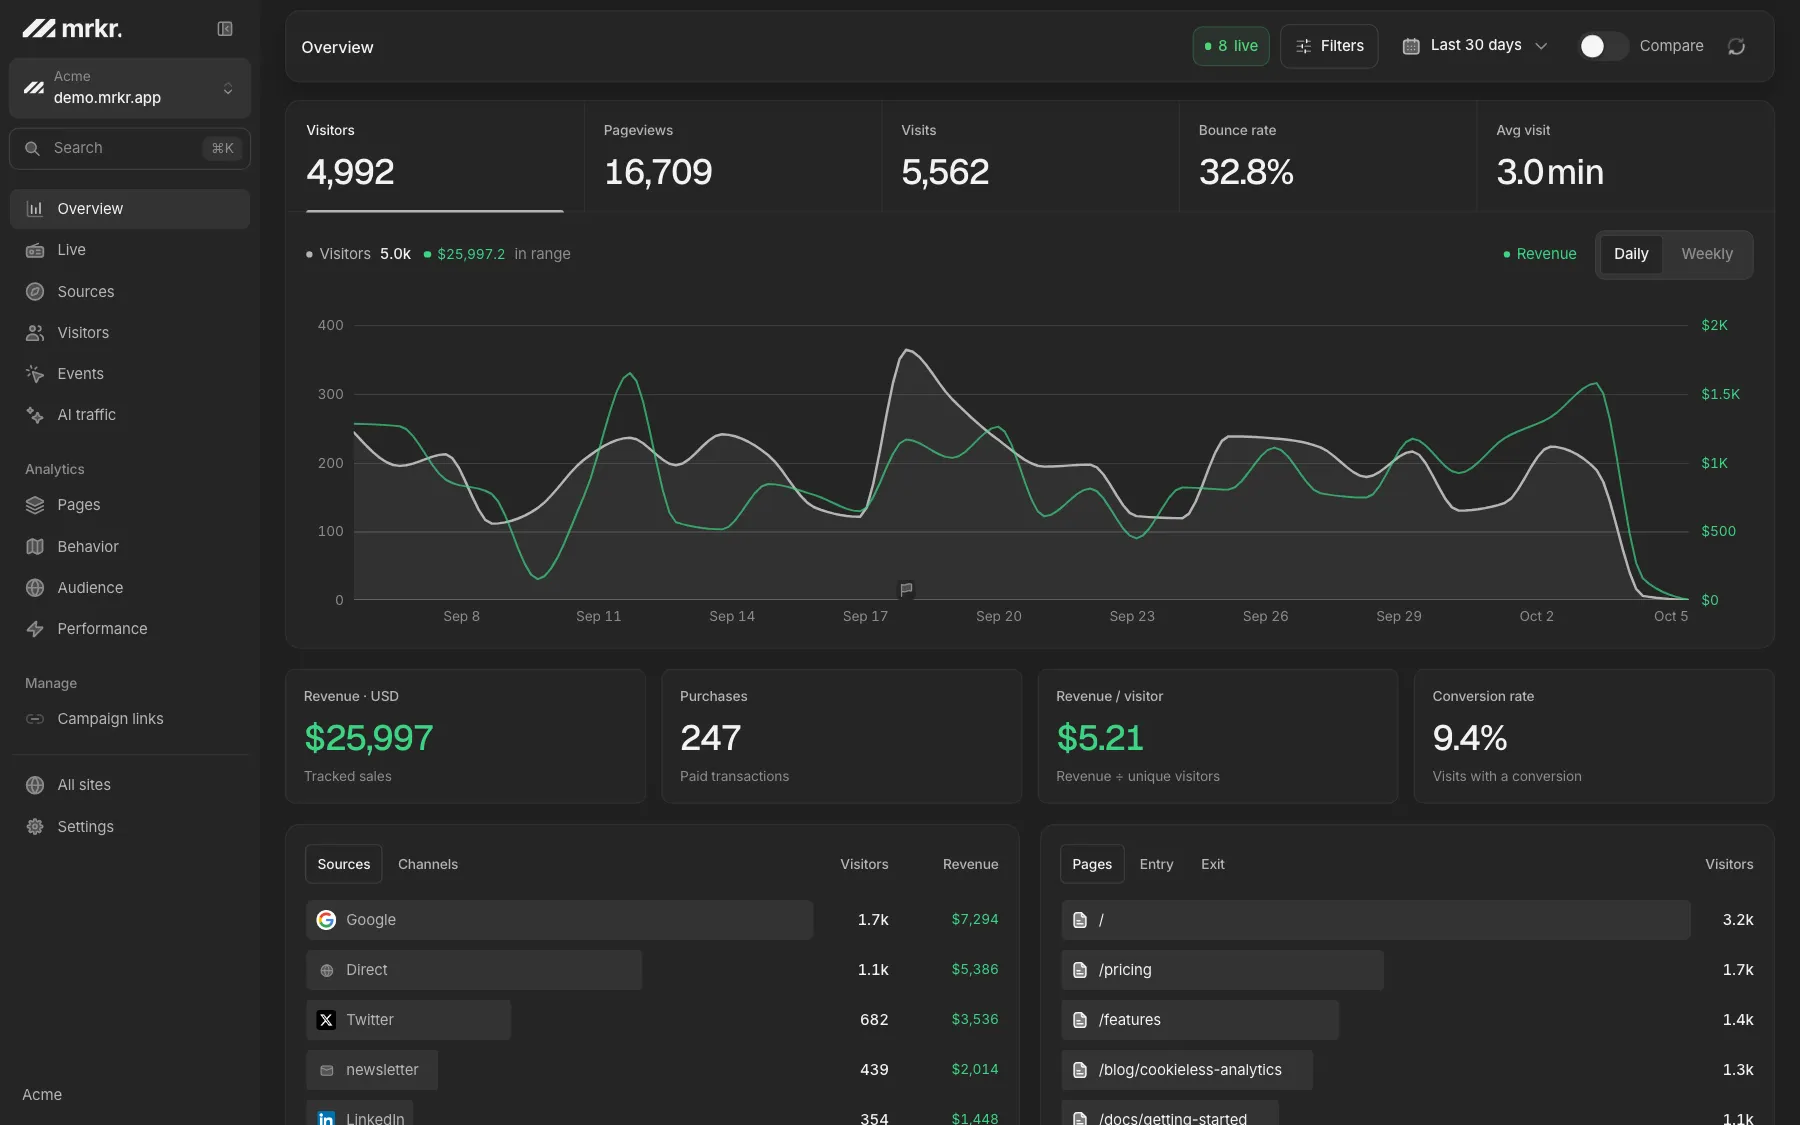
Slow pages can lose visitors without an obvious error. Compare per-page performance with traffic and conversion events using the same source, device and campaign filters.
Reading vitals without chasing ghosts.
Look at p75, then at p95
Passing at p75 and catastrophic at p95 means one broken case, often a device class or a third-party script.
Segment before you optimise
Slow on mobile, slow in one region, and slow everywhere are three different bugs with three different fixes.
CLS is usually images and fonts
Missing image dimensions and late-swapping webfonts account for most layout shift, and visitors report it least.
Fix in the lab, verify in the field
Iterate with a synthetic audit, then watch the field p75 move over the following days. Neither replaces the other.
Live demo
See the dashboard. The live demo includes the performance view alongside traffic, engagement and revenue on real demo data. No signup, no card.
Open the live demoThe honest limits.
Browser coverage is not uniform
LCP, CLS and INP need observers only Chromium implements. True of every field-data source, Google's included.
INP is approximated
mrkr reports the longest interaction latency observed, not a full distribution. It moves with the metric without matching its formal definition.
No synthetic monitoring, no alerting
mrkr does not run Lighthouse, crawl on a schedule, or page you when a p75 crosses a line. Pair it with a tool built to page.
The read is capped on wide ranges
Vitals come from samples, not counters, and the read is bounded. Percentiles reflect the samples read.
FAQ
What are Core Web Vitals?
A small set of user-experience measurements Google publishes thresholds for. Largest Contentful Paint measures loading, Cumulative Layout Shift measures visual stability, and Interaction to Next Paint measures responsiveness. mrkr also records Time to First Byte and First Contentful Paint as diagnostics.
How does mrkr measure Core Web Vitals?
In the browser, from real visits. The tracker uses the browser's own performance observers to capture each metric once per pageview and reports the values when the page is hidden. This is field data from your actual audience, not a synthetic run from a datacenter.
Why does mrkr grade at the 75th percentile?
Because an average hides the visitors having a bad time. The published thresholds are defined at p75, so three quarters of your visits must be under the good line for a page to pass. mrkr reports p75 and p95, so you can see both the grade and the tail.
Do web vitals count towards my plan?
No. Billing counts pageviews and nothing else, so web vitals, session replay and custom events are all stored without being metered. They measure how a page performed rather than something a visitor did, and charging you for mrkr's own instrumentation would be indefensible.
Can I see Core Web Vitals per page?
Yes. The performance view breaks every metric down by path, ordered by sample count, so a slow template shows up as a slow template rather than being averaged into a site-wide number that looks acceptable.
Does mrkr replace Lighthouse or PageSpeed Insights?
No, and they answer different questions. Lighthouse runs a synthetic audit in a controlled environment and tells you what to fix. mrkr reports what your real visitors experienced on real devices and networks, which is what the thresholds are actually judged on. Use both.
Start with one line of HTML.Your first visitors show up within a minute.