Bounce rate calculator. Sessions in, bounces in, rate out. Plus the part most calculators skip: what your tool counts as a bounce.
Calculated in your browser, nothing sent anywhere. Bounce rate only means something when you know what your tool counts as an interaction, which is the part of this metric that changed under everyone’s feet.
In short
How do you calculate bounce rate?
Bounce rate is bounced sessions divided by total sessions, as a percentage. If 4,620 of 8,400 sessions ended without a second pageview or any tracked interaction, that is 55%. What counts as a bounce differs between analytics tools, so the same visitors can produce very different rates.
Compared
What counts as a bounce? Four definitions in common use. This is why two tools on the same site can report rates thirty points apart, and why comparing your rate to a benchmark table is close to meaningless.
| Definition | A bounce is | Reports a rate that is | Used by |
|---|---|---|---|
| Single pageview | A session with exactly one pageview, however long it lasted | Higher on content sites | Classic Universal Analytics and most simple analytics tools |
| No engagement | A session under 10 seconds with no conversion and no second view | Lower, because reading counts as engagement | Google Analytics 4, inverted as engagement rate |
| No interaction | A session with no scroll, click, or custom event | Lower still on well-instrumented sites | Tools that count interaction events by default |
| Route-change aware | A session with only one view, counting client-side route changes as views | Realistic on single-page apps, wrong if the tracker is misconfigured | Anything correctly wired into an SPA router |
Whichever definition your tool uses, the rate is only comparable to itself. Track the trend on your own pages and ignore cross-site benchmarks.
Compared
Why your SPA bounce rate lies.
Tracker fires once, on initial load
- Every client-side route change is invisible to analytics.
- A visitor reading six screens looks identical to one who left immediately.
- Bounce rate climbs toward 100% and stays there no matter what you ship.
- Time on page is also broken, because there is no second event to measure against.
- The giveaway: a bounce rate above 90% on a site people obviously use.
Tracker hooked into the router
- Each route change reports a pageview with the new path.
- Sessions with real navigation stop being counted as bounces.
- Per-page numbers finally line up with what your app actually shows.
- The opposite failure appears if you double-fire on the same route, which pushes bounce rate toward zero.
- mrkr's tracker handles history API navigation, so client-side routes are counted without extra code.
Engagement says more than a bounce.
Bounce rate reduces a visit to a yes or no. Someone who read your entire article for four minutes and left satisfied is filed next to someone who hit the back button in two seconds, and the number cannot tell them apart.
Engagement time and conversion events add context. A visitor can read a useful article and leave satisfied, or complete an action without opening a second page. Check the outcome the page was intended to produce.
Reading the number honestly.
Judge the page by its job
A contact page or store locator answers one thing and lets people go. High rate, task done.
Split it by source
Broad social traffic bounces far more than branded search. A moving blend usually means a moving mix.
Bots inflate it
Crawlers hit one page and leave. On one live mrkr site they ran at 4.1x human pageviews in September 2026.
Check page speed first
A six-second render loses people before they can act. That bounce rate is a performance number.
A very low rate is a bug
Under about 15% is almost always a double-firing tracker or a tag installed twice.
Never optimise the metric
Firing a scroll event on load drops it to zero and improves nothing. Fix why people leave.
Live demo
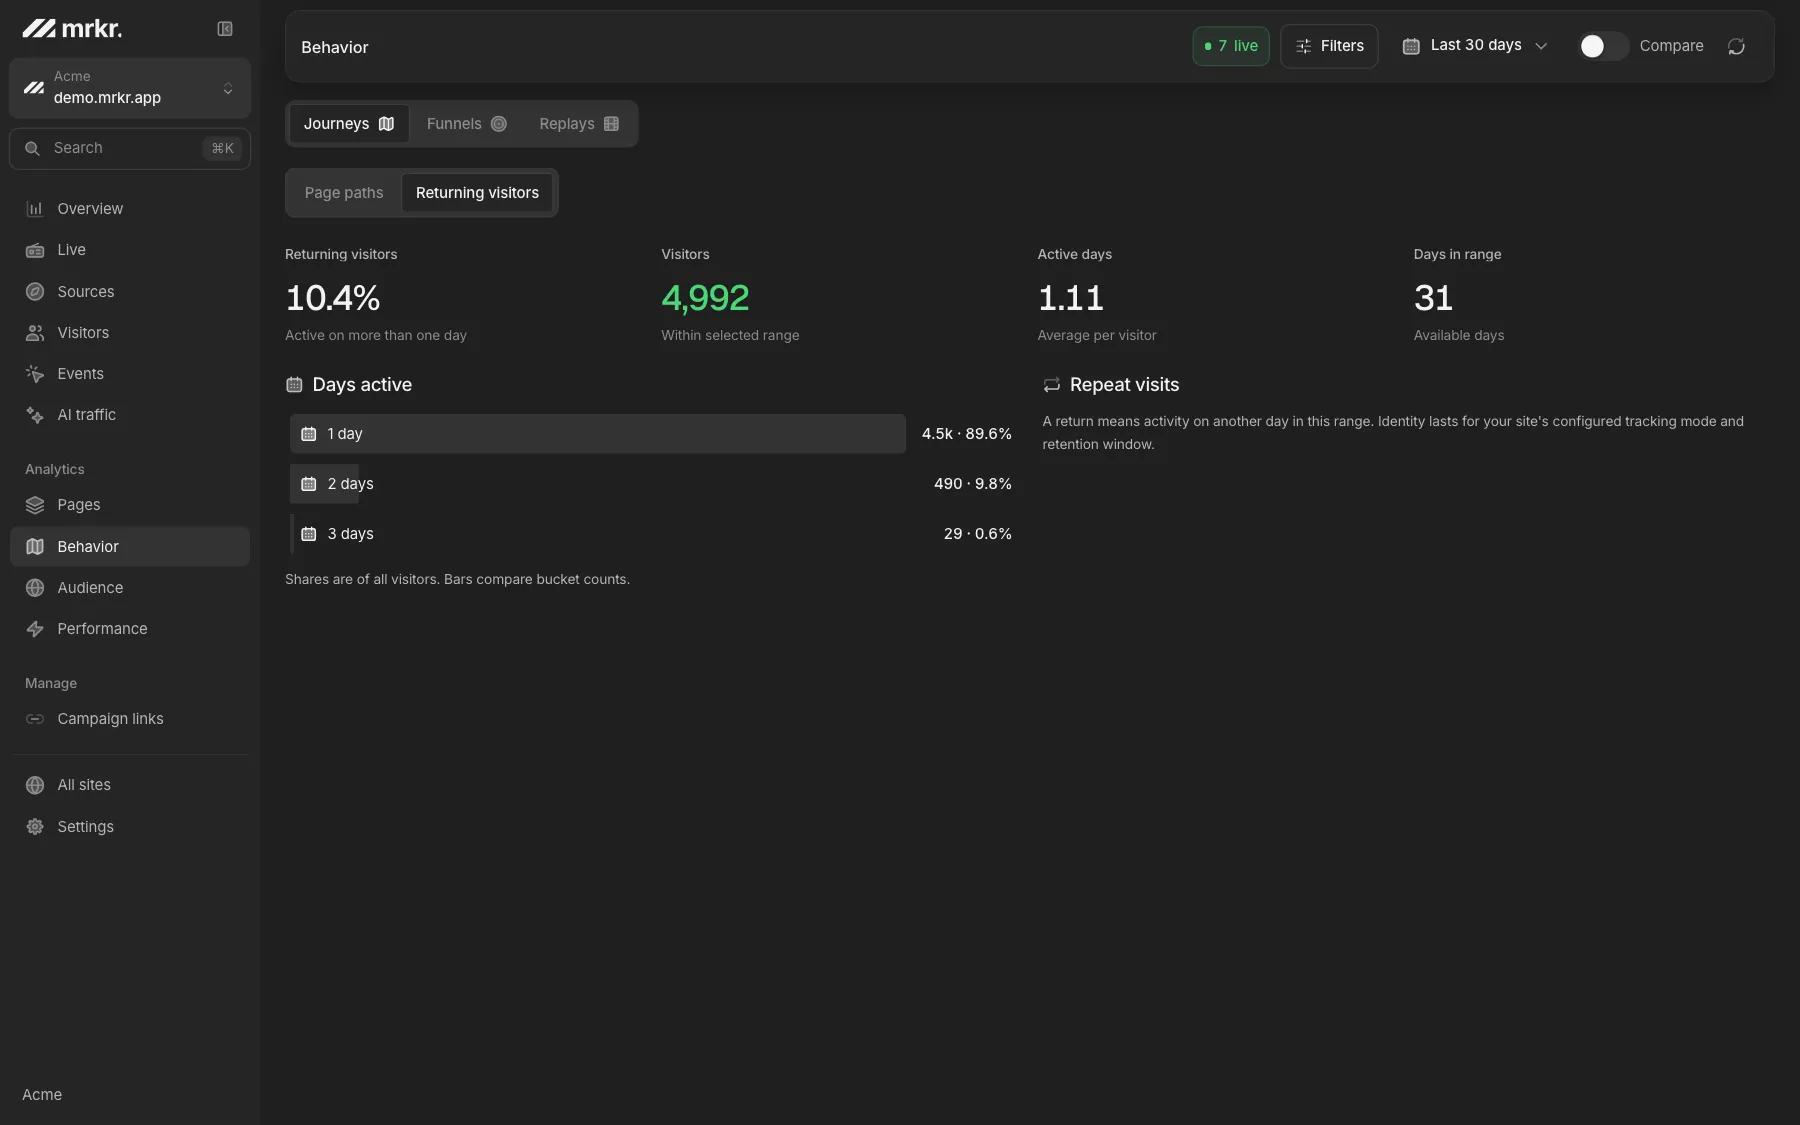
Look at what people did, not just whether they stayed. The mrkr demo shows engagement and per-page behaviour on a fully populated dashboard. No signup, no card, cookieless by default.
Open the live demoWhat should you look at instead? Bounce rate survives because it is easy to compute, not because it tells you what to do next. Three things that usually do.
Conversion events
A visitor can complete a useful action in one pageview. Track that action before treating every bounce as a failure.
The rate split by source and device
Mobile paid social behaving unlike desktop organic is a finding. The blend that hides it is not.
Replays of the bounced sessions
Twenty replays show the banner, the slow hero or the silent form error in ten minutes.
FAQ
How do you calculate bounce rate?
Divide bounced sessions by total sessions and multiply by 100. If 4,620 of 8,400 sessions ended without a second pageview or tracked interaction, the bounce rate is 55%. The hard part is agreeing what counts as a bounce, because that definition has changed and differs between tools.
What is a good bounce rate?
There is no universal number, because it depends on what the page is for. A blog post or a documentation page that answers the question and gets closed has done its job at an 80% bounce rate. A pricing page at 80% has a problem. Compare a page to itself over time, not to an industry average.
Why is my single-page app bounce rate so low or so high?
Both happen, for opposite reasons. If your SPA fires a pageview on every route change, almost no session looks like a bounce and your rate collapses toward zero. If it fires only once on the initial load and never again, every session looks like a bounce and the rate goes to nearly 100%. Neither number describes your visitors.
What is the difference between bounce rate and engagement rate?
They are the same measurement inverted. Google Analytics 4 defines engagement rate as the share of sessions that lasted over ten seconds, had a conversion, or had at least two pageviews, and bounce rate as everything else. A 45% engagement rate is a 55% bounce rate.
Does a high bounce rate hurt SEO?
Not directly. Google does not read your analytics. What can matter is the behaviour underneath it: if people return to the results page and click a different result, that pattern is visible to a search engine in a way your bounce rate is not. Fix the reason, not the metric.
Does this calculator send my numbers anywhere?
No. It runs entirely in your browser, with no account, no email gate and no server call.
Start with one line of HTML.Your first visitors show up within a minute.