Conversion rate calculator. Visitors in, conversions in, rate out. Then flip it: what traffic or what rate hits your target.
The denominator. Use whichever unit your funnel is measured in.
Signups, purchases, demo requests. Whatever counts as a win.
Optional. Average order value or expected lifetime value.
Enter visitors and conversions to see the rate.
Everything is calculated in your browser. Nothing you type is sent anywhere, and there is no account to create.
In short
How do you calculate conversion rate?
Conversion rate is conversions divided by visitors over the same period, expressed as a percentage. Three hundred signups from twelve thousand visitors is 300 / 12000 = 0.025, or 2.5%. Keep the denominator consistent: compare sessions with sessions or visitors with visitors, never a mix of both.
Compared
Which denominator should you use? The same hundred conversions can look like three different rates. Pick the unit that matches the decision you are making, then hold it steady.
| Denominator | Answers | Rate tends to be | Use it for |
|---|---|---|---|
| Unique visitors | What share of people who found us did the thing | Higher | Acquisition and campaign reporting |
| Sessions | What share of visits ended in a conversion | Lower | Checkout and purchase funnels |
| Pageviews | Almost nothing useful | Much lower | Avoid. One person reading four pages is not four chances. |
| Funnel step entries | What share of people who reached this step got past it | Varies per step | Finding where a multi-step flow leaks |
Whichever you pick, write it down next to the number. Six months later nobody remembers, and the first person to recalculate it a different way will report a crisis that never happened.
A single rate hides where it broke.
A site-wide conversion rate of 2.5% is an average of a dozen very different journeys. Branded search converting at 9% and a cold display campaign converting at 0.3% average out to a number that describes neither.
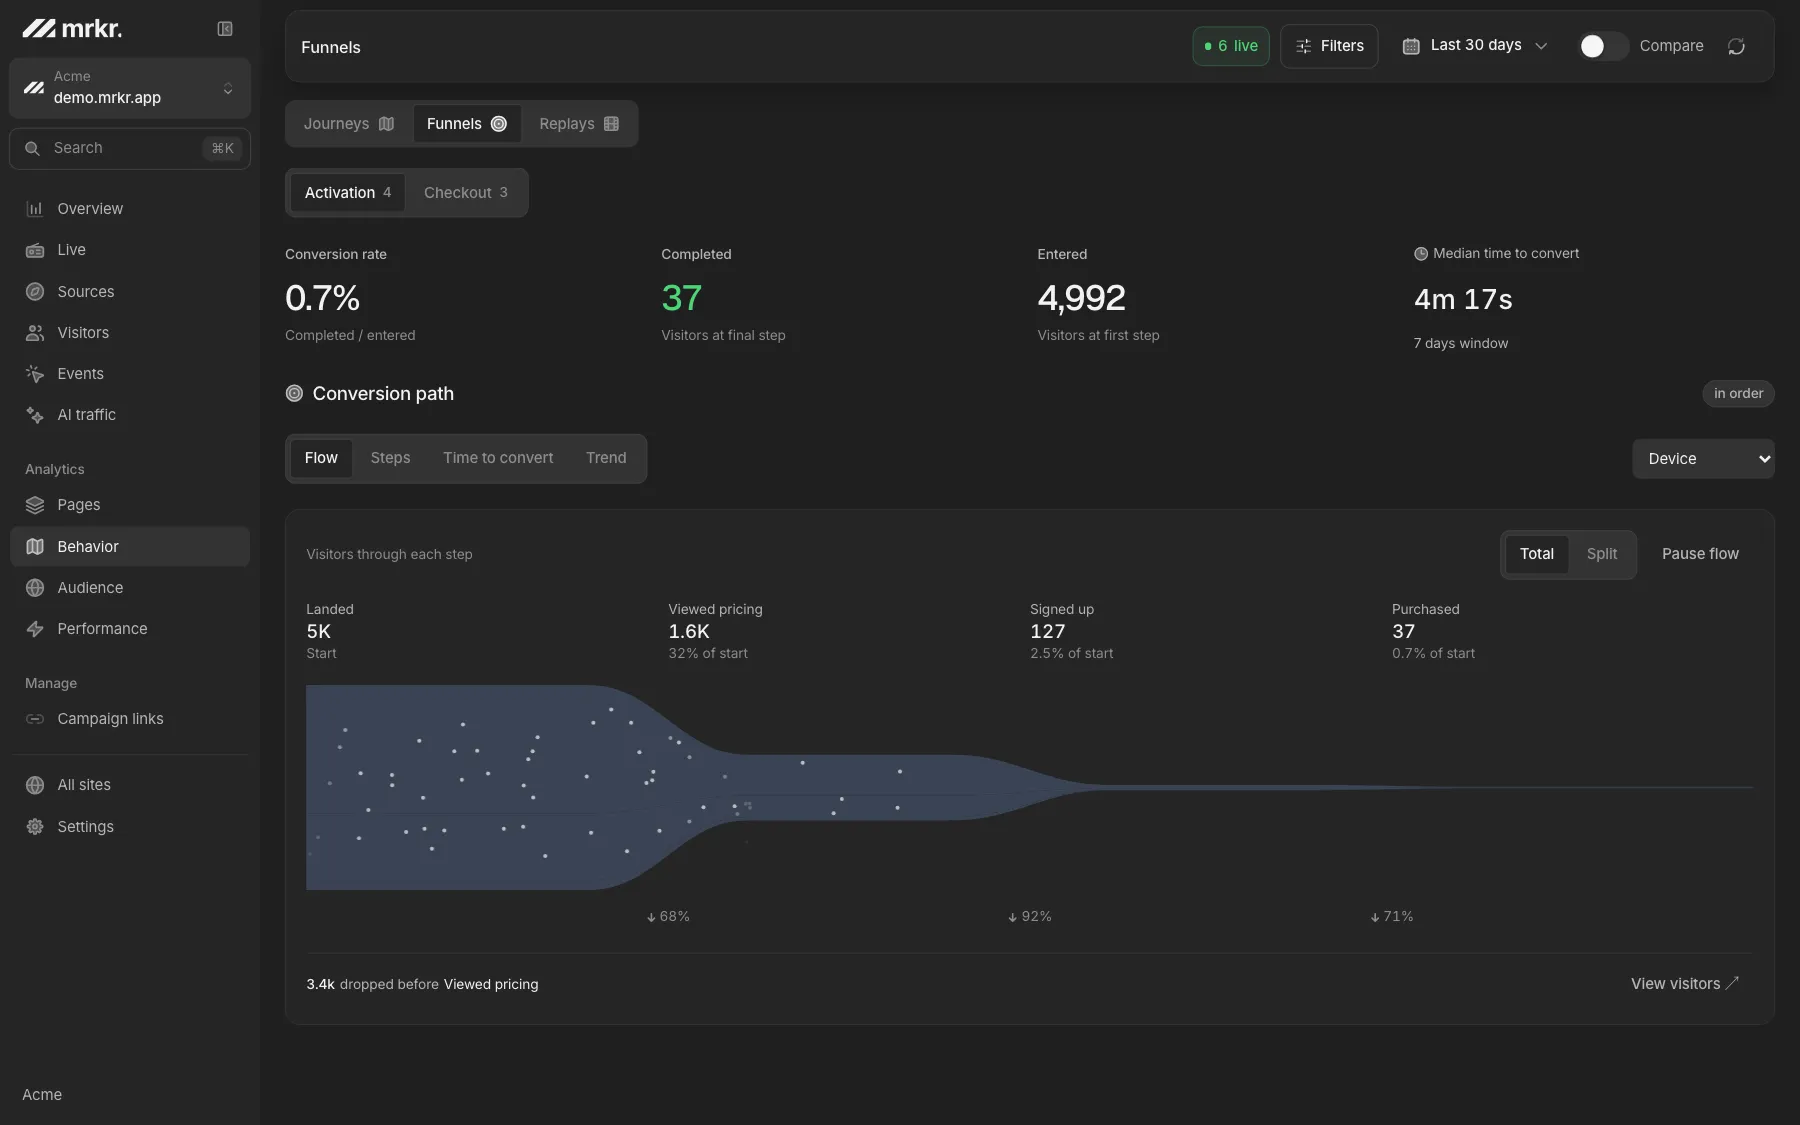
A funnel splits it up. Each step shows how many people arrived and how many carried on, so the drop from pricing to checkout stops being a rounding error in the average and becomes a specific step you can go and look at.
Reading the number without fooling yourself.
Segment before you celebrate
A rate that rose because a weak source dried up is not a win. Check the mix first.
Small numbers move a lot
On 400 visitors, four extra conversions is a whole percentage point of swing.
Bots inflate the denominator
Crawlers never convert. On one live mrkr site, filtered bots ran at 4.1x human pageviews in September 2026.
Define the conversion once
Trial started, card added and first payment are three rates, not one. Pick one and name it.
Live demo
See a rate broken down by step. The mrkr demo has fully populated funnels, sources and goals on real demo traffic. No signup, no card, and cookieless by default.
Open the live demoIs it a traffic problem or a page problem?
Say you get 12,000 visitors a month, convert at 3%, and have been asked for 500 conversions. At today’s rate that takes about 16,700 visitors, roughly 4,700 more than you have. On today’s traffic it takes a 4.17% rate, a 39% relative lift. Buying 4,700 visitors has a price you can look up. A 39% lift from page changes is months of testing with no guarantee.
There is a third route the calculator does not show, and it is often the cheapest: change the traffic mix rather than the volume. If one source converts at 9% and another at 0.4%, shifting spend moves the blended rate without touching the page. That only works if your campaigns are tagged well enough to read a rate per source.
FAQ
How do you calculate conversion rate?
Divide conversions by visitors over the same period, then multiply by 100. Two hundred signups from ten thousand visitors is 200 / 10000 = 0.02, which is a 2% conversion rate. The only thing that makes this hard is deciding what counts as a visitor and what counts as a conversion.
Should the denominator be visitors, sessions, or pageviews?
Pick one and never mix them. Unique visitors gives a higher rate than sessions, because one person can come back three times. Sessions is the usual default for a purchase funnel. Pageviews is almost always wrong, because it counts the same person reading four pages as four chances to convert.
What is a good conversion rate?
It depends entirely on the traffic and the ask. Branded search converts several times better than cold display traffic to the same page, so a single benchmark number across a whole site tells you almost nothing. The useful comparison is your own rate segmented by source, and your own rate last month.
Why did my conversion rate drop when traffic went up?
Usually because the new traffic is colder. A campaign that doubles your visitors with people who have never heard of you will lower the average rate even while raising total conversions. Split the rate by source before treating it as a problem.
Is a change in conversion rate ever just noise?
Very often. On a few hundred visitors, a handful of conversions either way moves the rate by a full percentage point. Before acting on a difference between two variants, check the sample size you would need for it to mean anything.
Does this calculator send my numbers anywhere?
No. The arithmetic runs in your browser and nothing is transmitted or stored. There is no account, no email gate and no server call on this page.
Start with one line of HTML.Your first visitors show up within a minute.