See who comes back. Repeat visits, distinct active days and recorded conversion journeys. Read what was observed, with the identity limits visible.
In short
What does returning traffic tell you?
Returning visits show repeated activity from an observed visitor. Active days show how often that identity was seen within the range. Together with sources and conversion journeys, they help explain traffic beyond a count of arrivals.
Open Visitors and choose Returning to inspect the sessions behind the count. In Journeys, the Returning visitors view shows active days and engagement. Source, country, device and event filters keep the question focused.
Anonymous cookieless identities rotate daily. A new day is a new anonymous identity, so a cross-day history needs the optional cookie mode and appropriate consent. Browser identity still does not imply cross-device identity.
Compared
Read each number precisely.
| Report | What it measures | Limit |
|---|---|---|
| Returning visitors | Visitors with repeat recorded sessions | The selected range and identity mode define the group |
| Active days | Distinct days of observed activity | Separate-day anonymous identities cannot be joined |
| Time to purchase | First retained visit to first recorded purchase | Retained history can begin after the person’s actual first visit |
| Signup-week retention curves | Not provided | Choose a dedicated product analytics tool when this is required |
Live demo
Inspect the visits behind the count. Explore recorded sources, repeat sessions and purchase timing in the demo visitor list. No signup or card. The demo data is illustrative.
Open the live demo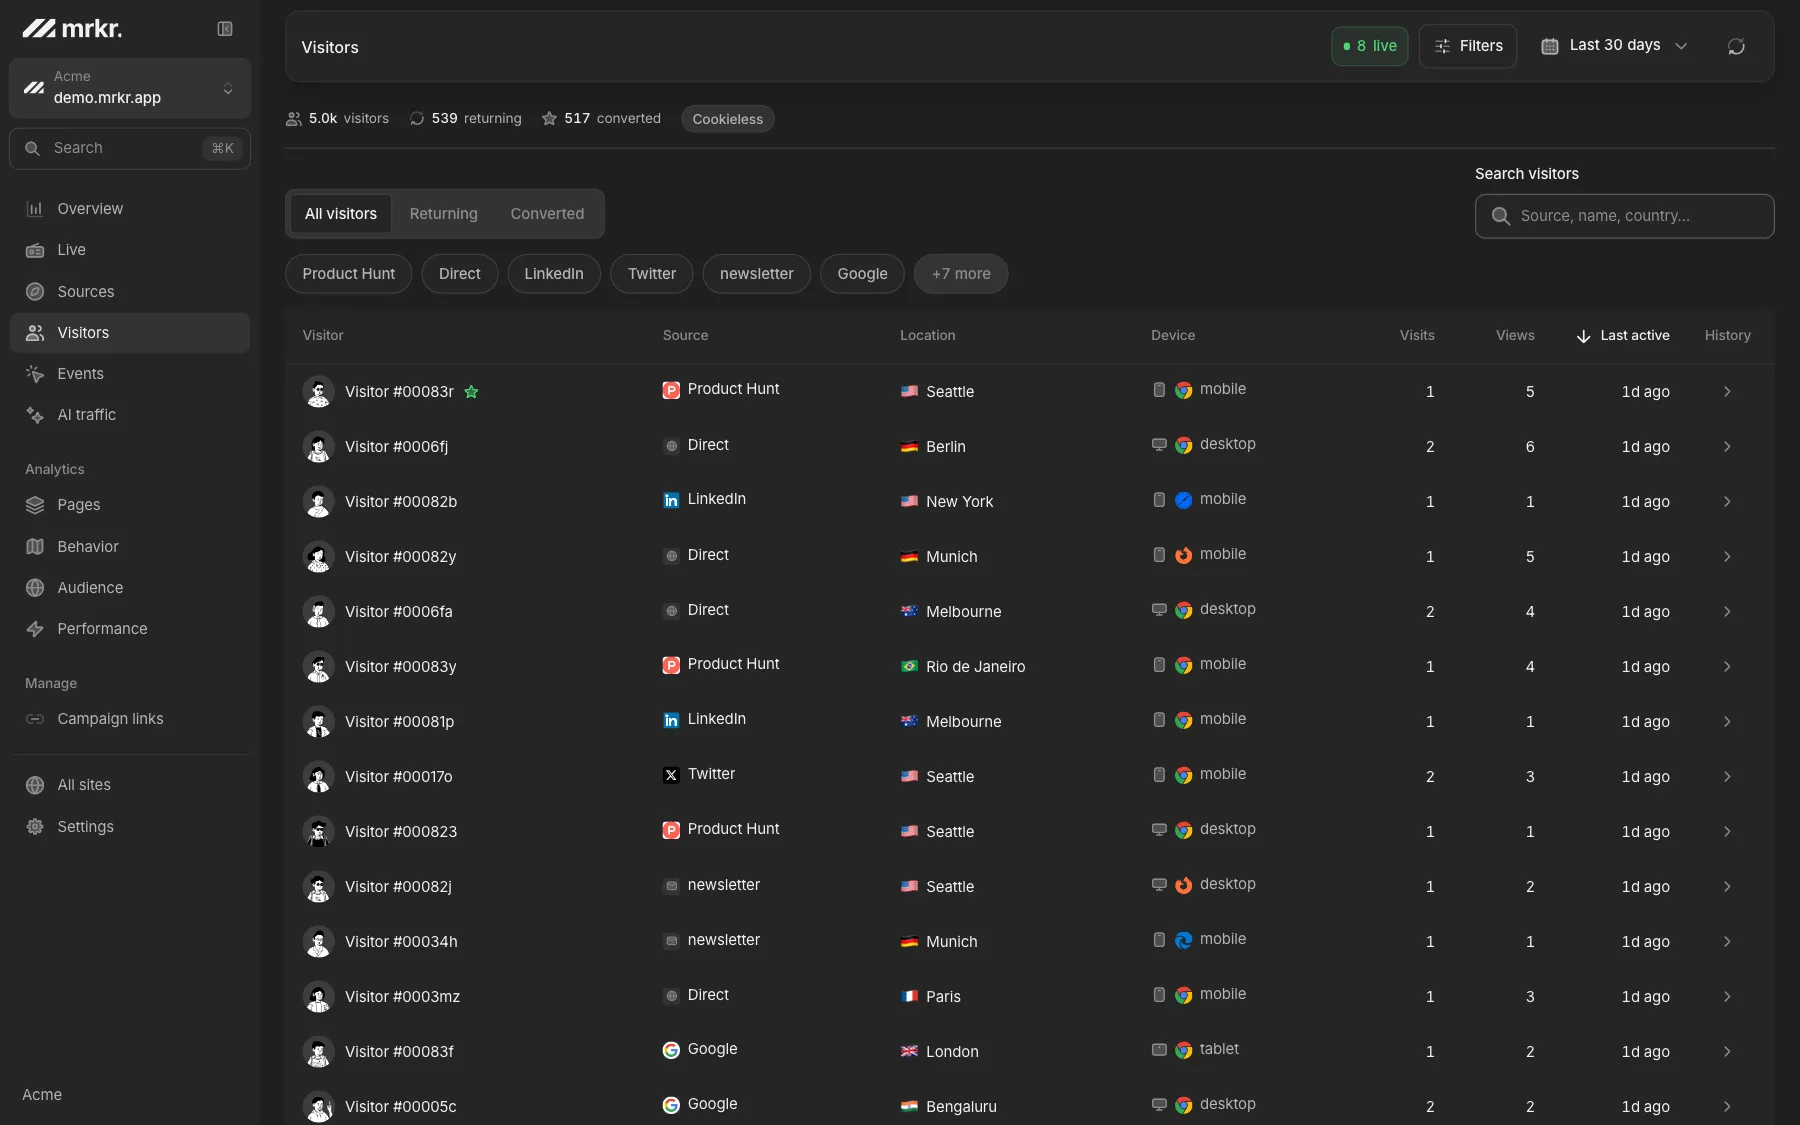
FAQ
How does mrkr show returning visitors?
The visitor list includes a Returning segment for visitors with more than one recorded session in the selected range. Journeys also includes engagement and active-day reporting. These are observed-activity reports, not signup-week retention curves.
What is an active day?
A distinct day on which an observed visitor had activity. Multiple sessions on the same day do not create extra active days. The identity mode determines whether separate days can be joined.
Can cookieless analytics recognize a visitor tomorrow?
mrkr’s anonymous cookieless identifier rotates daily. It cannot join those anonymous identities across days. Optional per-site cookie mode can preserve browser identity, with the consent requirements that apply on your site.
Can I see how long a visitor took to buy?
Yes. A visitor’s details show recorded sessions and elapsed time from the first retained visit to the first recorded purchase. It describes retained observed history, not the person’s account age or activity on other devices.
Follow the conversion journey
Start with one line of HTML.Your first visitors show up within a minute.